
If you run more than one restaurant, you have probably had this month. You open the P&L, the labor line is higher than it should be, and the number is staring back at you with no explanation attached. Restaurant labor cost is up across the industry, so this is not in your head.
Why did my restaurant labor cost go up?
Your labor percentage can rise for four different reasons. Sales fell while staffing held. Pay rates went up. Hours increased. Or coverage changed. They are not the same problem, and they do not have the same fix, which is why the number alone never tells you what to do. You have to run it down.
For scale on the pressure, the National Restaurant Association reports full-service labor, salaries and wages including benefits, at a median of 36.5% of sales using 2024 operating data in its 2025 Restaurant Operations Data Abstract, up from around 33% a decade earlier. One important caution on that figure. The association is explicit that its numbers are medians across many operators, not a target any single restaurant should be held to. So your labor percentage is not "wrong" for sitting above or below it. The benchmark tells you the water is rising industry-wide. It cannot tell you what is happening in your building.
And here is where most operators go wrong. They see a labor percentage that is too high and they reach for the same tool every time. Cut hours. Send someone home early. Lean on the managers. That is treating a symptom before you have made a diagnosis, and it can make the actual problem worse. So before you cut a single shift, run the number down and find out what actually changed. Here is the diagnostic I use.
Step one: check the denominator
Labor percentage is a fraction. Labor dollars on top, sales on the bottom. Before you touch the top, look at the bottom. A labor percentage can climb without a single extra dollar of payroll, simply because sales fell and the schedule did not move with them.
This is the mistake that gets a good manager blamed for a problem that is not theirs. If a location did the same payroll it always does but sales dropped 10%, the labor percentage jumps, and it looks like a labor problem. It is not. It is a sales problem wearing a labor costume. The fix is to right-size the schedule to the new volume, not to chew out a GM who staffed exactly as planned. So the first question is never "why is labor high," it is "did labor dollars actually rise, or did sales fall underneath them?"
Step two: separate rate from hours
If labor dollars really did rise, now you split that increase into its two parts. You are paying either a higher rate, or for more hours. They are not the same problem and they do not have the same fix.
On the rate side, look at wage changes, a new minimum-wage step, or a round of raises. That kind of increase is mostly structural, and the answer is usually menu price or productivity, not the schedule. On the hours side, look at three things that quietly inflate payroll while nobody is watching. Overtime, which costs you time and a half for hours you probably could have scheduled at straight time. Scheduled hours versus actual hours, because a crew that clocks in early and clocks out late turns a clean schedule into an expensive one. And coverage, because additional paid manager coverage, like a second manager on a slow daypart, hides in the labor line and never shows up as overtime. When a labor line creeps up with no wage change, those three, overtime, hours running over the schedule, and coverage, are the first places to look.
Step three: compare your locations fairly
Now the part that matters most for a multi-unit operator, and the part almost everyone gets wrong. You cannot rank your stores by labor percentage alone and call the high one inefficient. A number by itself is not a verdict.
Two locations at the same 36% labor. The headline number is identical. The cause, and the fix, are different. Illustrative multi-unit example.
| Metric | Store A | Store B | What it means |
|---|---|---|---|
| Labor percentage | 36% | 36% | The headline number is identical. |
| Sales trend | Sales fell 10% | Sales are on plan | Store A may look inefficient because the denominator moved. |
| Overtime | Minimal | Up meaningfully | Store B has a control issue to review. |
| Actual vs scheduled hours | On plan | Running over schedule | Store B needs schedule and clock discipline. |
| Manager coverage | Unchanged | Additional paid manager coverage added | Store B has coverage dollars to explain. |
| Likely fix | Right-size the schedule to lower volume | Tighten scheduling, overtime, and coverage | Same percentage. Opposite action. |
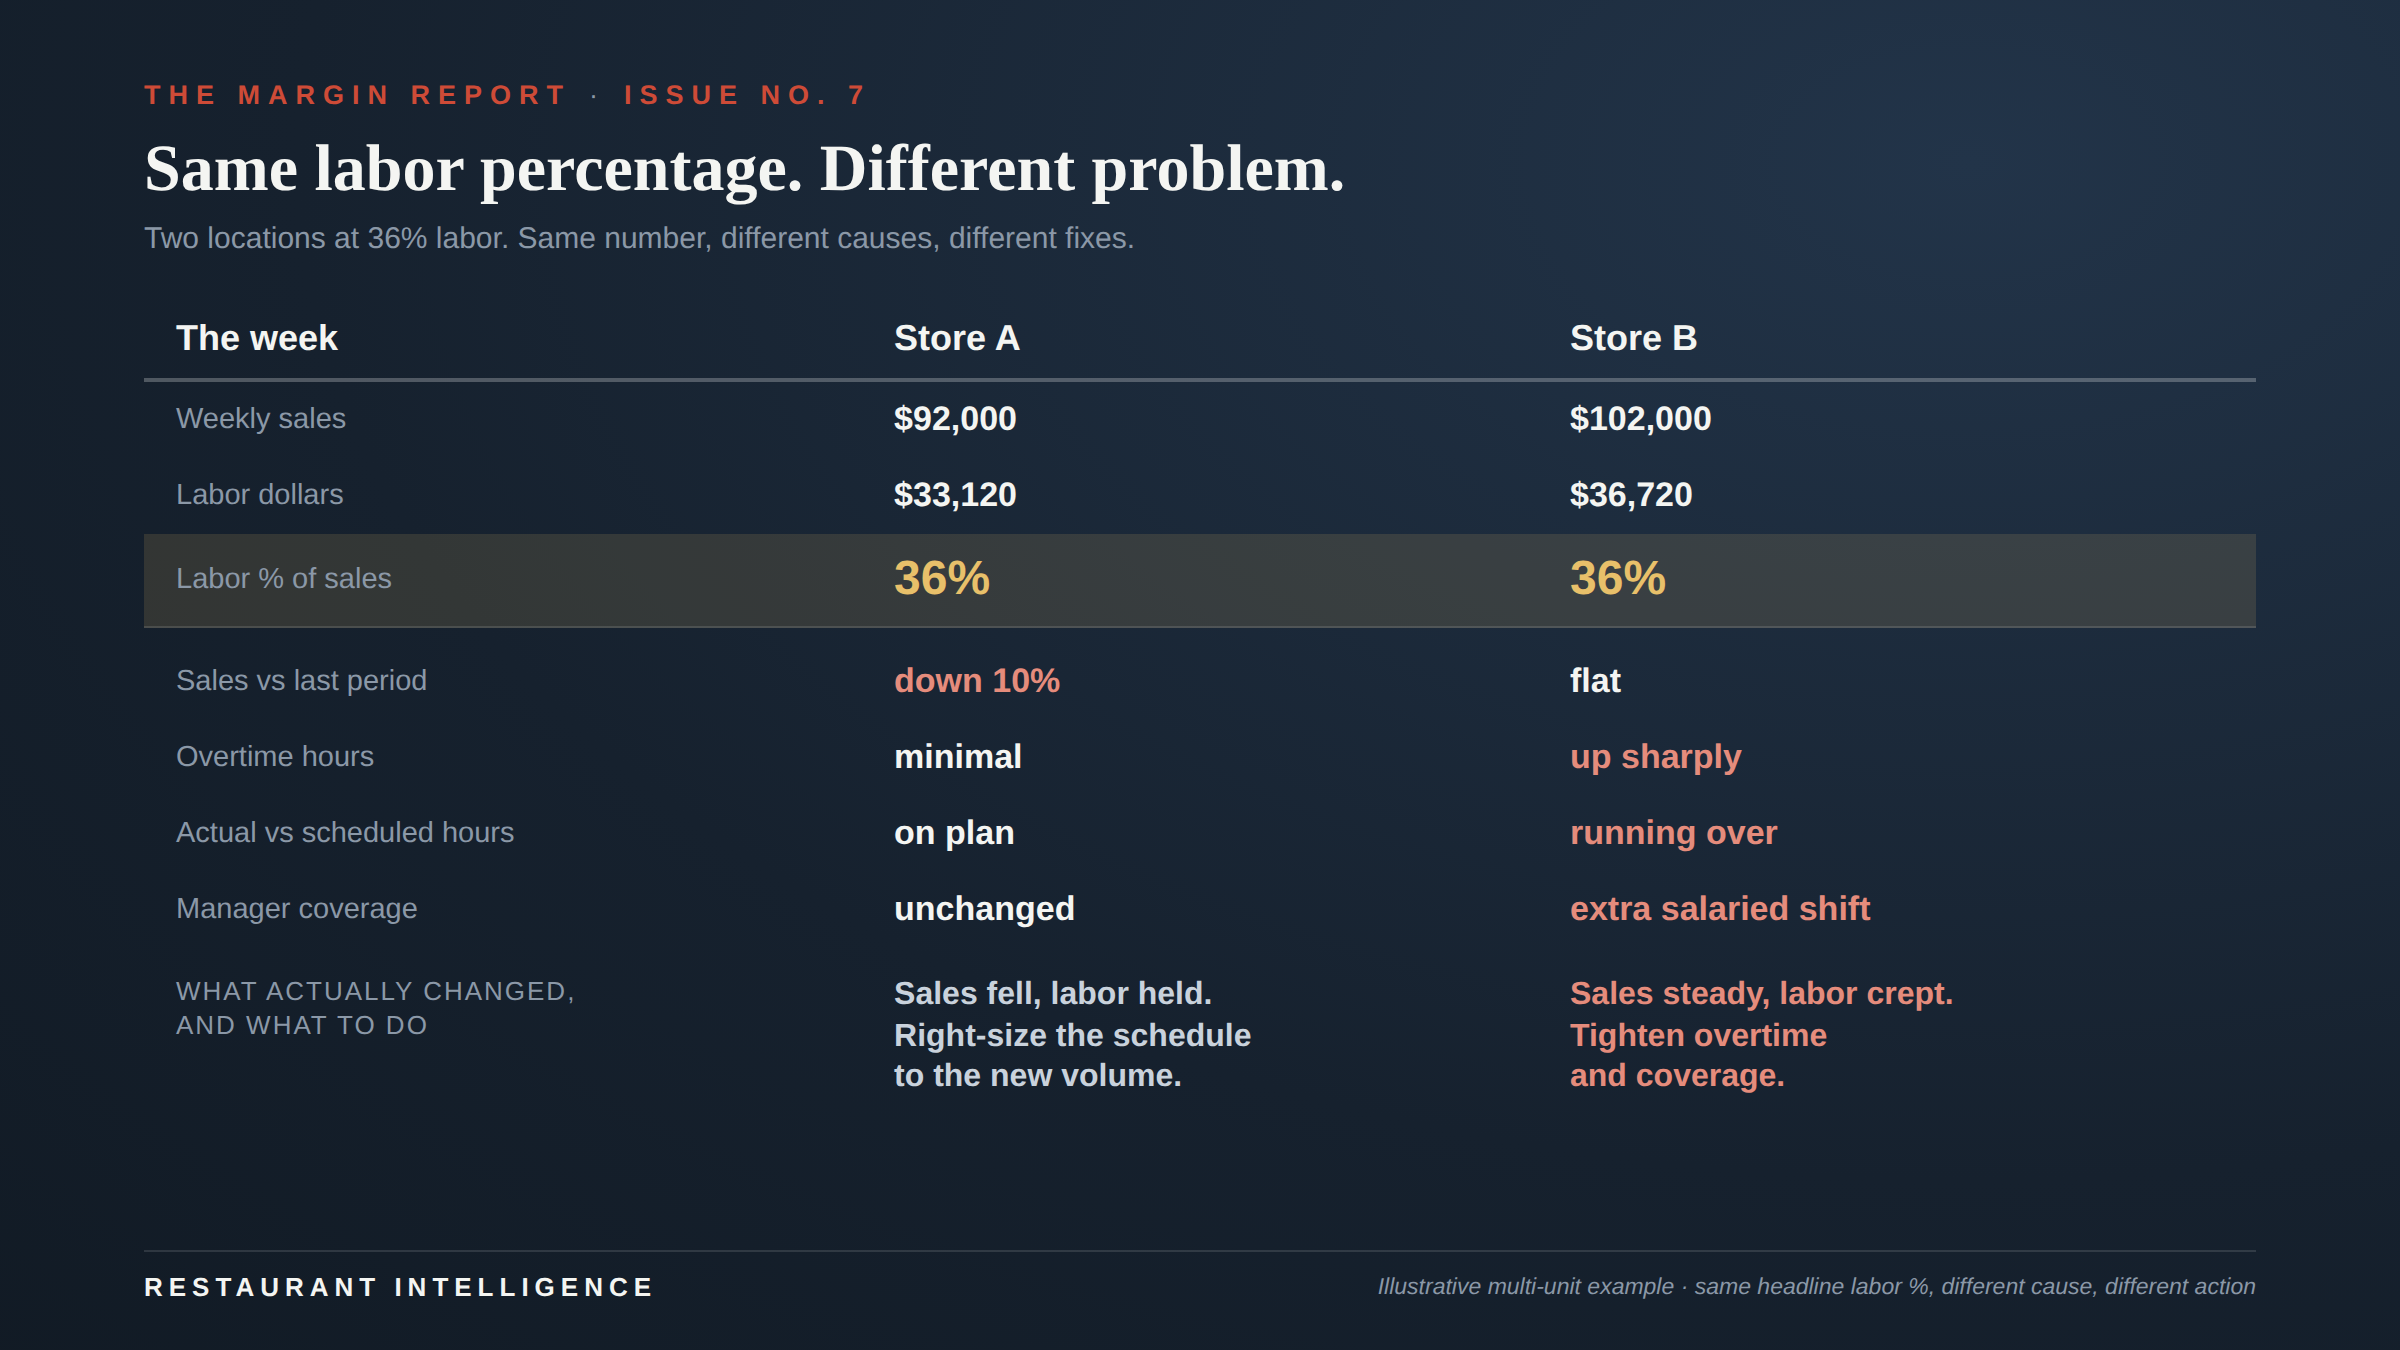
Look at those two stores. Both are running 36% labor. If all you saw was that line, you would treat them the same, or worse, you would praise one manager and scold the other for no reason. But they are not the same at all. Store A is at 36% because its sales fell 10% while the schedule held. Its overtime is minimal, its hours are on plan, its coverage is unchanged. That store does not have a labor-efficiency problem, it has a sales problem wearing a labor costume, and the fix is to right-size the schedule to the lower volume. Store B is at the exact same 36% for a different reason. Its sales are fine, but overtime is up, actual hours are running over the schedule, and someone added paid manager coverage. That store has a genuine labor-control problem, and the fix is to tighten scheduling and coverage. Both need action. The actions are not the same.
Same headline number. Different cause. Different fix. That is why you compare locations only after you account for sales volume, service model, hours of operation, and the roles on the floor. Before you account for those things, the labor percentage is not telling you who is efficient. By itself, the percentage cannot tell you whether sales volume, pay rates, or hours caused the difference.
Step four: assign the follow-up
A diagnosis nobody owns is just a conversation. The last step is what turns this from a one-time autopsy into a system, and it is where multi-unit operators actually win or lose the labor line.
Decide what your weekly report has to flag. Not a wall of numbers, three or four exceptions. Any store where labor percentage moved more than a point or two from plan. Any overtime above a set threshold. Any location where actual hours ran meaningfully over scheduled. Then, and this is the part people skip, put a name next to each exception. The area manager owns the schedule variance. The GM owns the overtime. Whoever owns the P&L owns the sales-driven ones. And set the day it gets reviewed, every week, same time, so nothing waits for the month-end books to surface a problem you could have caught on a Tuesday.
This is the same lesson as the prime cost issue, pointed at labor. A monthly number is an autopsy. A weekly number with an owner and a review date is a steering wheel. If you have not read the prime cost breakdown yet, it is worth a look: the prime cost breakdown.
The reframe
Labor cost being too high is never the finding. It is the headline. The finding is underneath it, in whether the denominator moved, whether you are paying rate or hours, and whether the store you are worried about is actually less efficient or just less busy.
The operators who control labor are not the ones who cut the fastest. They are the ones who diagnose before they cut, because they know that the same 36% can mean two completely different things, and cutting the wrong one costs you a good manager, a bad Friday, or both. Find out why first. The fix is easy once you know what you are actually fixing.
A note on the numbers
The labor benchmark is from the National Restaurant Association's 2025 Restaurant Operations Data Abstract, based on more than 900 operators: full-service salaries and wages including benefits at a median of 36.5% of sales in 2024, up from roughly 33% across the 2010, 2013, and 2016 reports. The two-store comparison is an illustrative multi-unit example built on realistic numbers to show the method, not a specific company. Your own figures will differ. The diagnostic does not. Run the denominator, split rate from hours, compare fairly, then assign the follow-up.
Need the same diagnostic discipline across food cost, labor, and vendor spend?
Labor is only one part of prime cost. If the same blind spot exists in food cost, purchasing, vendor credits, or manager follow-up, that is the point of the BusStop Margin Diagnostic.
Start a conversationNext Week in Restaurant Intelligence
The One-Page Weekly Number That Ties It All Together
We have walked the whole P&L now: sales, prime cost, the lease, waste, and labor. Next week, the single weekly scorecard the best operators actually run, and how to build one that flags a problem while you can still fix it.
About Restaurant Intelligence
Restaurant Intelligence is written by Bradley Busenius, founder of BusStop Hospitality, drawing on more than two decades in restaurant operations and foodservice. It is a weekly publication analyzing the economics, operations, finance, and strategy shaping the restaurant industry. Rather than reporting the news, each issue explains the business behind the business through data, financial analysis, and operational perspective.
The Margin Report · Published every Monday, 7:00 a.m. Central